In the second of a new series on embedded biases in multi-asset funds, Paul Ilott, managing director at Scopic Research, takes a closer look at why it is important for advisers to consider different volatility parameters.
If you are an adviser or paraplanner who recommends multi-asset funds as part of your investment proposition to clients - whether this is in the form of an outsourced or in-house centralised investment service, or whether you simply recommend multi-asset funds generally - then you need to know about embedded biases in multi-asset funds.
This is because they have a bearing on suitability, understanding the likely investment journey, and monitoring performance.
Intended outcomes are one form of embedded bias, and when considering investment outcomes, volatility parameters can sometimes be key.
Multi-asset teams sentiment indicator: Clouds lift but caution remains in Q1
Volatility parameters
Volatility parameters are used by many suites of multi-asset funds, and below we discuss the nuances between them, the implications for client suitability and the performance traits we might expect.
The three primary types of volatility parameter used are:
- Volatility corridor
- Volatility ceiling
- Volatility guide
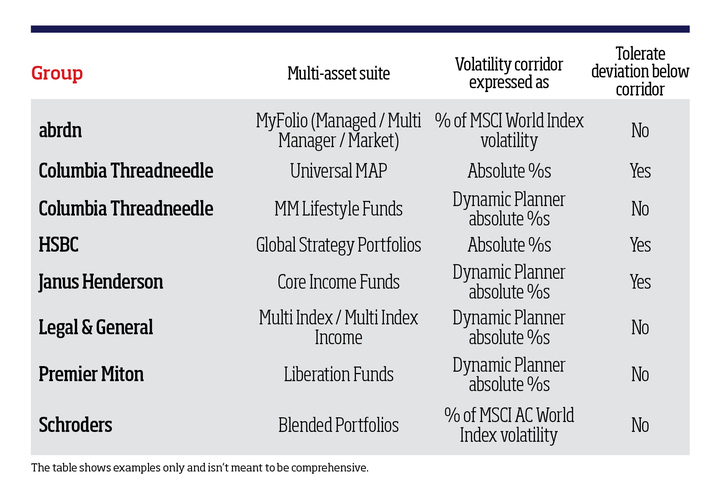
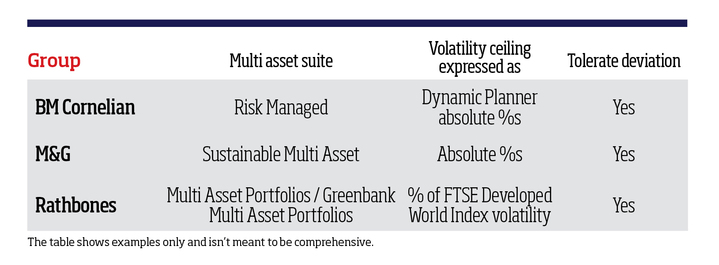
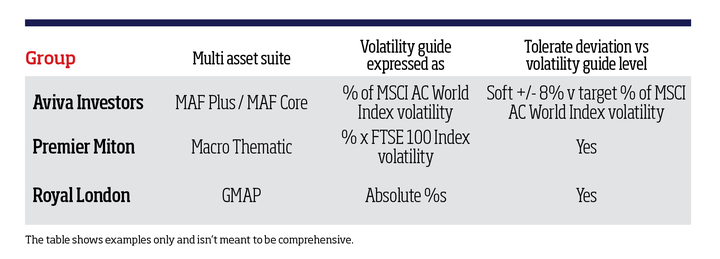
In the tables below (using data from Scopic Research), you will see which multi-asset fund suites use each type, whether the volatility parameter used is expressed in absolute or percentage terms, and whether the relevant investment team tolerates any deviations from it.
Volatility corridor

The key aim for portfolios in the volatility corridor camp is for each portfolio in the suite to maintain its longer-term volatility within a different corridor of volatility framed by lower and upper levels. Typically, the volatility corridor is expressed either in absolute terms (for example, between 8% and 10% annualised) or as a percentage of the volatility of a stock market index.
In most cases, the relevant investment team has no tolerance for volatility being outside of the designated corridor.
However, this is not always the case and as you can see from the above table, a small number of investment teams do tolerate volatility being temporarily below the lower level of the corridor under exceptional circumstances - with a view to defending against greater loss of capital.
This needs to be taken into account when monitoring performance.
Volatility ceiling

The aim for volatility ceiling portfolios is for each portfolio in the suite to maintain its longer-term volatility below a specified ceiling level. Again, the volatility ceiling is generally expressed in absolute terms or as a percentage of the volatility of a stock market index.
Arguably, operating to a volatility ceiling affords the investment team greater flexibility to be able to defend capital during periods of market stress when compared to a portfolio that operates to a strict ‘volatility corridor' outcome.
In exceptional circumstances, many investment teams in the volatility ceiling camp will tolerate a portfolio's volatility falling to a level that might ordinarily be designated for the portfolio that sits immediately beneath it in the same suite in terms of volatility profile - always provided that the hierarchy of volatility profiles throughout the entire suite is still maintained.
Volatility guide

Like portfolios in the volatility corridor and volatility ceiling camps, the strategic asset allocation (SAA) is a key driver of returns for portfolios in volatility guide camp. However, rather than targeting a specified corridor or ceiling level of volatility, the investment team calculates each portfolio's expected long term volatility level using the expected returns and co-variances of returns of the asset classes in the SAA. The expected volatility level is then used simply as a guide for what investors might expect over the long term. The realised volatility level might be above or below this level for indefinite periods and the volatility guide level isn't specifically targeted. Arguably, this is the most flexible camp.
Absolute % volatility versus % of stock market index volatility
In theory, during periods of market stress, operating to a volatility parameter expressed in terms of a percentage of the volatility of a stock market index should afford the investment team the scope to be able to decide whether or not to maintain a portfolio's level of sensitivity to equity market risk with a view to the team looking through near-term conditions to the time when markets might recover. When this occurs, it might mean investors having to tolerate a higher level of volatility in the short term - hopefully with a view to being able to profit from it later. In some cases, an investment team operating to a strict volatility corridor expressed in absolute terms might not believe it has the flexibility to be able to do this.
Tolerating deviances from the volatility parameter
Generally, those investment teams who tolerate deviating from the volatility parameter will only do so temporarily and with a view to defending against elevated downside risk under poor market conditions. Arguably, these portfolios are more performance focused.
Again, in theory (although not always in practice), a portfolio that operates to a volatility corridor and where the investment team has no tolerance for deviating from it, should offer the prospect of a more predictable volatility profile.
The question for advisers is then whether they should opt for an investment team who places greater emphasis on performance and downside risk, or one for whom managing volatility is the primary aim. The answer may depend on a combination of the adviser's own business model, investment beliefs, and the requirements of the end client.
Paul Ilott is managing director at Scopic Research
Multi-asset DNA reports on individual funds can be accessed for free by Investment Week and Professional Adviser readers at www.scopicresearch.co.uk


