
Latest market views on the US, Europe and Asia were released today (23 August) in a briefing note by Altaf Kassam, Head EMEA Head of Investment Strategy & Research, State Street Global Advisors.
US Outlook
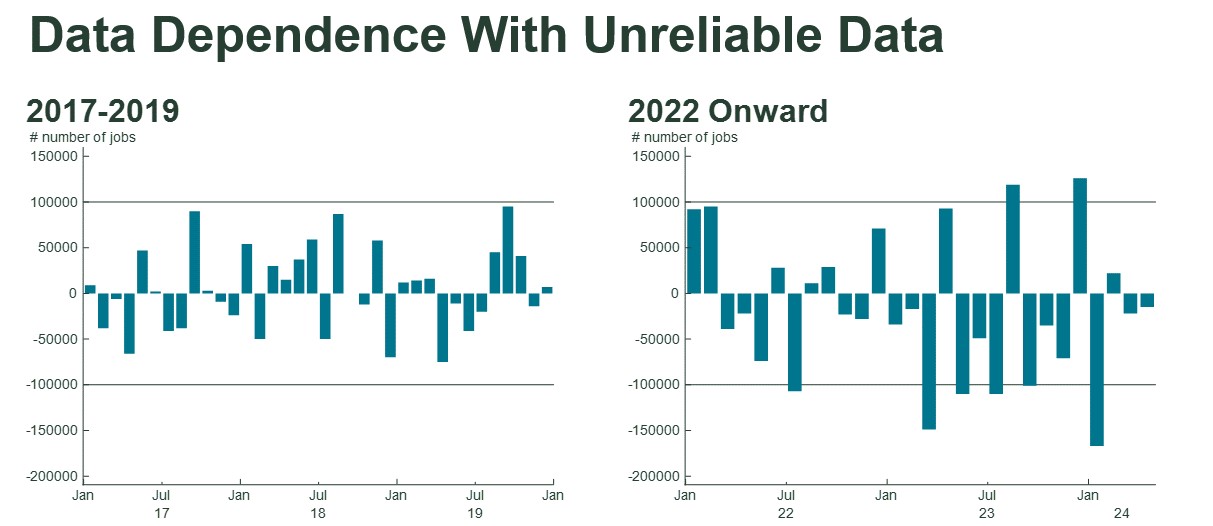
The Federal Reserve minutes make it clear that rate cuts are coming (some wanted to cut in July). The minutes also showed that a dwindling camp of policymakers feared a premature easing in monetary policy could restart inflation. The Fed is late, and policy operates with a lag, so the economic benefit of these cuts will take some time to come through (policy lags are why “data dependency” is so dangerous).
Historically, it is unlikely for a Fed chair to pre-commit to a policy move at Jackson Hole, as this would front-run the next FOMC meeting. Instead, we expect Chair Powell will focus on the progress that has been made towards fulfilling the dual mandate. Our latest views on the Fed rate path are:
1. The current probabilities for the 18th September meeting are 100% probability for a 25bpsrate cut and 34.5% probability for a larger 50bps move.
2. The Fed has everything it needs to deliver a 25 basis point (bp) rate cut in September. But not 50 bps, at least not without a really bad August employment report. Having long advocated for a summer start to rate cuts, we find ourselves in the odd position of pushing back against what now appear to be unwarranted calls for a 50 bp cut in September. It’s not that the macro data do not warrant rates being 50 bp lower than where they are. Rather, having signaled a single 2024 rate cut in the June Summary of Economic Projections (SEP), the Fed would need something more dramatic than what has transpired so far to deliver a jumbo cut in September. Assuming that the data do not force the FOMC’s hand beforehand, we think a 25 bp in September, alongside an updated dot plot showing 3-4 cuts this year is a much more balanced approach. The September Fed meeting features new SEP forecasts, so even if the Fed moves just by 25 bps, they will signal more.
3. In short, we are not in panic mode. Measured cuts seem appropriate, and three 25 bp cuts at each meeting (September, November and December) should suffice. The plan might need adjustment if the labor market begins to deteriorate significantly. Our base case is for the Fed Funds Rate to be between 3.0%-3.25% by end of 2025, so 3 cuts this year from the Fed is still a reasonable outcome.
Our base case is still for a soft-landing in the US. The Sahm Rule was triggered this time around because the rise in unemployment rate was assisted by a large rise in "temporary layoffs" and "employees absent due to bad weather" caused by Hurricane Beryl, and we have long argued that many scrutinised data series are flawed due to low response rates or pandemic-related seasonal adjustments that require revisiting. The latter category includes initial jobless claims and retail sales.
Stop dreaming of the quiet life
Until mid-July, markets had been surprisingly stable with risk assets delivering outsized gains despite growing concerns of an imminent slowdown in the US economy. The dramatic rise in volatility in equity, bond and currency markets at the start of August was entirely consistent with our Mid-Year Global Market Outlook call “Stop dreaming of the quiet life”.
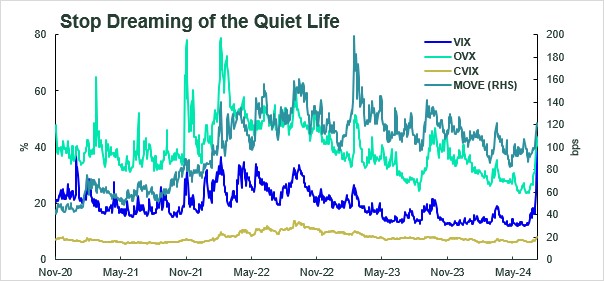
Source: State Street Global Advisors. Bloomberg Finance L.P., as of May 31, 2024. VIX = Chicago Board Options Exchange (CBOE) Volatility Index; OVX = CBOE Crude Oil Volatility Index; CVIX = Deutsche Bank FX Volatility Indicator ; MOVE = ICE BofA MOVE Index
In hindsight this volatility was an overreaction caused by worries over a recession in the US as the rise in the unemployment rate triggered the Sahm rule. There were a number of contributing factors to the extreme moves such as surprise Bank of Japan hike, poor earnings reports from some of the US tech giants, summer (low) liquidity, and the feedback loop that the speed and scale of the moves may have triggered some VaR models, and prompted forced stops which would have further exacerbated initial moves. Simple profit taking may also have exacerbated the strong market correction as the tech sector has had the strongest market rally leading to a most concentrated S&P500 index recorded since 1999 as measured by effective stocks.
Source: Macrobond, SSGA Economics, as of June 13, 2024
Japan
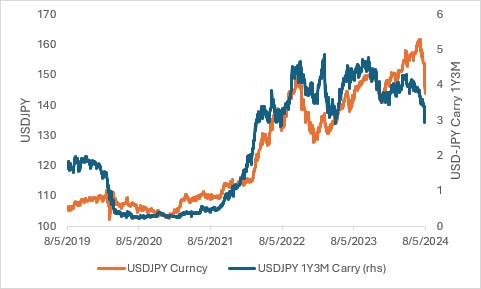
Turning to the Japan market, the most important thing to note is that the dramatic move lower in USDJPY doesn’t appear strange relative to fundamentals, particularly interest rate differentials. It was the move up to 162 that looked strange. Now USDJPY is just reverting back toward the levels it should have been at all along, chart below. That is not to say we shouldn’t expect some upside retracement after such a huge move, but that retracement should be limited and there is ample room for further yen appreciation by end 2024 (135-140) and even more by end 2025 or H1 2026 (125-130). That said, a hard landing for the US and global economy would accelerate and amplify yen strength relative to this baseline.
Carry trades continue to remain under pressure amid mounting concern about the global economic growth cycle. Some position adjustment was probably inevitable after a long run of good performance amid low volatility. The focus of investor risk aversion has centered on EM carry currencies, but it may transpire that commitments to monetary policy easing from the Fed and a raft of mixed data may stabilize what has been a volatile month for EM currencies.
Positioning is also a critical factor in explaining the recent sharp move. The build-up of excessive short yen positions were squeezed out forcing investors to cover their positions quickly.
• During the trek up to 162 speculative and longer-term investors were aggressive in jumping on board. The short yen carry trade remains massive. Perhaps this move has shaken out a large portion of the short run speculative positions, but the longer-term positions remain and are vulnerable. There is ample room for large-scale yen buying over the next 1-2 years.
• Those longer-term positions are in the form of unhedged overseas investments held by groups such as large Japanese pension funds, life insurance companies, and more recently by retail investors as they flocked to global equity funds under the enhanced NISA program.
• The buildup of massive unhedged foreign assets equity positions has provided a windfall as equities rise and the yen became historically cheap. Now that the cost of currency hedging is beginning to fall and curves steepen, the incentive to increase foreign currency hedges or repatriate capital will rise. This recent volatility provides a stark reminder that such large foreign currency positions can have sharp downside risk. We do not believe we will see panic hedging, or at least not much panic hedging, but we are entering a phase of the cycle in terms of risk and interest rate carry where hedges will gradually make more sense and that will provide a steady source of yen buying.
As we noted in our Mid-Year Global Market Outlook, the move to introduce and encourage more shareholder-friendly measures and governance practices could be a key medium-term catalyst to reduce the long-standing valuation discount applied to Japanese stocks. The substantial run-up in Japanese benchmark indices to mid-July had been driven by a mixture of yen weakness and broad equity market buoyancy but we believe rising stock buybacks and a more shareholder-friendly stance can be a more enduring means of closing the valuation gap versus international peers.
On the Bank of Japan (BoJ):
1. The BoJ was perhaps too hawkish for markets’ liking in its latest meeting, but we saw it coming.
2. We think the BoJ’s terminal policy rate could still be 1.0%, but the increasing likelihood of rate cuts in the US mean that any subsequent hikes (BoJ) will be more measured and gradual.
3. The underlying macro fundamentals continue to improve; nominal wage growth in July was the highest in 27 years, and real wages have turned positive. The absence of any Yen intervention so far is noteworthy.
China
China’s property sector struggle continues to weigh on economic recovery as July data released last week posted another set of negative readings for new building prices. Although the drop in prices narrowed from the previous month, the slide underscores the slow recovery in sentiment. Despite rolling out measures to ease purchasing rules for homebuyers as well as proposing local government buying unsold units, the impact on household purchasing preferences have yet to materialize. Credit data echoed the same message as yuan-denominated bank loans to the real economy shrank for the first time in almost twenty years. Weak corporate and household demand draw parallels to Japan’s ‘balance sheet recession’ and call for more forceful policy support in 2H. It’s vital that authorities step in and boost confidence before the pessimism on the economic outlook becomes entrenched.
Europe
European markets have been more of a passenger than a driver in recent weeks with European stock markets moving broadly in sympathy with their international peers. Distinctly different sector exposures and idiosyncratic political risks (on each side) probably explain much of the divergent fortunes of European and US stock markets in the run up to the peak in mid-July. However, equity markets tend to be highly correlated especially in corrections and European stocks (with the notable exception of the FTSE 100) participated in the downdraft in a broadly similar degree to their US peers. Incidentally the scale of the moves in both US and European mainstream benchmarks paled in comparison with the moves in Japanese benchmarks.
Looking out over a multi-quarter horizon we have been cautious on European stocks relative to their large cap US counterparts due to higher EPS growth prospects and greater resilience of those projected earnings for US companies. As noted above, there was some disappointment on the US tech earnings front in recent days but we caution that this is very recent and anecdotal more than widely empirical. Changes in the earnings growth estimates and earnings revision (among other factors such as relative valuations) will guide us in the coming months.
For some added perspective: in our tactical positioning we are currently running a modest overweight to European stocks, a moderate overweight to EM stocks and a moderate underweight to Asia Pacific equities. We note that the timeline for these tactical positions is measured in months and not the typical (indicative) 1-year horizon envisioned in our GMO.
European currencies have been relatively stable during this risk-off episode. Against the US dollar the Euro has not moved any great degree while the British pound has slipped modestly and the Swiss franc has firmed modestly
by Altaf Kassam, Head EMEA Head of Investment Strategy & Research, State Street Global Advisors


